Random Forest
· 6 min read
0) Importing Packages & Data , EDA
library(tidyverse)## Warning: 패키지 'tidyverse'는 R 버전 3.6.3에서 작성되었습니다## -- Attaching packages ------------------------------------------------------ tidyverse 1.3.0 --## √ ggplot2 3.3.1 √ purrr 0.3.4
## √ tibble 3.0.1 √ dplyr 1.0.0
## √ tidyr 1.1.0 √ stringr 1.4.0
## √ readr 1.3.1 √ forcats 0.5.0## Warning: 패키지 'tibble'는 R 버전 3.6.3에서 작성되었습니다## Warning: 패키지 'tidyr'는 R 버전 3.6.3에서 작성되었습니다## Warning: 패키지 'purrr'는 R 버전 3.6.3에서 작성되었습니다## Warning: 패키지 'forcats'는 R 버전 3.6.3에서 작성되었습니다## -- Conflicts --------------------------------------------------------- tidyverse_conflicts() --
## x dplyr::filter() masks stats::filter()
## x dplyr::lag() masks stats::lag()library(tidymodels)## Warning: 패키지 'tidymodels'는 R 버전 3.6.3에서 작성되었습니다## -- Attaching packages ----------------------------------------------------- tidymodels 0.1.0 --## √ broom 0.5.6 √ rsample 0.0.6
## √ dials 0.0.6 √ tune 0.1.0
## √ infer 0.5.1 √ workflows 0.1.1
## √ parsnip 0.1.1 √ yardstick 0.0.6
## √ recipes 0.1.12## Warning: 패키지 'broom'는 R 버전 3.6.3에서 작성되었습니다## Warning: 패키지 'dials'는 R 버전 3.6.3에서 작성되었습니다## Warning: 패키지 'scales'는 R 버전 3.6.3에서 작성되었습니다## Warning: 패키지 'infer'는 R 버전 3.6.3에서 작성되었습니다## Warning: 패키지 'parsnip'는 R 버전 3.6.3에서 작성되었습니다## Warning: 패키지 'recipes'는 R 버전 3.6.3에서 작성되었습니다## Warning: 패키지 'rsample'는 R 버전 3.6.3에서 작성되었습니다## Warning: 패키지 'tune'는 R 버전 3.6.3에서 작성되었습니다## Warning: 패키지 'workflows'는 R 버전 3.6.3에서 작성되었습니다## Warning: 패키지 'yardstick'는 R 버전 3.6.3에서 작성되었습니다## -- Conflicts -------------------------------------------------------- tidymodels_conflicts() --
## x scales::discard() masks purrr::discard()
## x dplyr::filter() masks stats::filter()
## x recipes::fixed() masks stringr::fixed()
## x dplyr::lag() masks stats::lag()
## x dials::margin() masks ggplot2::margin()
## x yardstick::spec() masks readr::spec()
## x recipes::step() masks stats::step()library(pROC)## Warning: 패키지 'pROC'는 R 버전 3.6.3에서 작성되었습니다## Type 'citation("pROC")' for a citation.##
## 다음의 패키지를 부착합니다: 'pROC'## The following objects are masked from 'package:stats':
##
## cov, smooth, varlibrary(randomForest)## Warning: 패키지 'randomForest'는 R 버전 3.6.3에서 작성되었습니다## randomForest 4.6-14## Type rfNews() to see new features/changes/bug fixes.##
## 다음의 패키지를 부착합니다: 'randomForest'## The following object is masked from 'package:dials':
##
## margin## The following object is masked from 'package:dplyr':
##
## combine## The following object is masked from 'package:ggplot2':
##
## marginlibrary(plot3D)## Warning: 패키지 'plot3D'는 R 버전 3.6.3에서 작성되었습니다data = read_csv("data/pulsar_stars.csv")## Parsed with column specification:
## cols(
## `Mean of the integrated profile` = col_double(),
## `Standard deviation of the integrated profile` = col_double(),
## `Excess kurtosis of the integrated profile` = col_double(),
## `Skewness of the integrated profile` = col_double(),
## `Mean of the DM-SNR curve` = col_double(),
## `Standard deviation of the DM-SNR curve` = col_double(),
## `Excess kurtosis of the DM-SNR curve` = col_double(),
## `Skewness of the DM-SNR curve` = col_double(),
## target_class = col_double()
## )head(data)## # A tibble: 6 x 9
## `Mean of the in~ `Standard devia~ `Excess kurtosi~ `Skewness of th~
## <dbl> <dbl> <dbl> <dbl>
## 1 141. 55.7 -0.235 -0.700
## 2 103. 58.9 0.465 -0.515
## 3 103. 39.3 0.323 1.05
## 4 137. 57.2 -0.0684 -0.636
## 5 88.7 40.7 0.601 1.12
## 6 93.6 46.7 0.532 0.417
## # ... with 5 more variables: `Mean of the DM-SNR curve` <dbl>, `Standard
## # deviation of the DM-SNR curve` <dbl>, `Excess kurtosis of the DM-SNR
## # curve` <dbl>, `Skewness of the DM-SNR curve` <dbl>, target_class <dbl>이 데이터는 Pulsar Star를 찾는 데이터셋이다. Pulsar star란 전자기파 광선을 뿜는 자전하는 중성자별이라고 한다. target_class가 1이면 Pulsar star고 0이면 일반 별이다.
skimr::skim(data)| Name | data |
| Number of rows | 17898 |
| Number of columns | 9 |
| _______________________ | |
| Column type frequency: | |
| numeric | 9 |
| ________________________ | |
| Group variables | None |
Variable type: numeric
| skim_variable | n_missing | complete_rate | mean | sd | p0 | p25 | p50 | p75 | p100 | hist |
|---|---|---|---|---|---|---|---|---|---|---|
| Mean of the integrated profile | 0 | 1 | 111.08 | 25.65 | 5.81 | 100.93 | 115.08 | 127.09 | 192.62 | ▁▁▇▇▁ |
| Standard deviation of the integrated profile | 0 | 1 | 46.55 | 6.84 | 24.77 | 42.38 | 46.95 | 51.02 | 98.78 | ▂▇▁▁▁ |
| Excess kurtosis of the integrated profile | 0 | 1 | 0.48 | 1.06 | -1.88 | 0.03 | 0.22 | 0.47 | 8.07 | ▅▇▁▁▁ |
| Skewness of the integrated profile | 0 | 1 | 1.77 | 6.17 | -1.79 | -0.19 | 0.20 | 0.93 | 68.10 | ▇▁▁▁▁ |
| Mean of the DM-SNR curve | 0 | 1 | 12.61 | 29.47 | 0.21 | 1.92 | 2.80 | 5.46 | 223.39 | ▇▁▁▁▁ |
| Standard deviation of the DM-SNR curve | 0 | 1 | 26.33 | 19.47 | 7.37 | 14.44 | 18.46 | 28.43 | 110.64 | ▇▁▁▁▁ |
| Excess kurtosis of the DM-SNR curve | 0 | 1 | 8.30 | 4.51 | -3.14 | 5.78 | 8.43 | 10.70 | 34.54 | ▂▇▂▁▁ |
| Skewness of the DM-SNR curve | 0 | 1 | 104.86 | 106.51 | -1.98 | 34.96 | 83.06 | 139.31 | 1191.00 | ▇▁▁▁▁ |
| target_class | 0 | 1 | 0.09 | 0.29 | 0.00 | 0.00 | 0.00 | 0.00 | 1.00 | ▇▁▁▁▁ |
0-1) Random Forest를 위해 변수명을 바꾸는 작업이 필요하다.
colnames(data) = c("Mean_of_the_integrated_profile","Standard_deviation_of_the_integrated_profile",
                   "Excess_kurtosis_of_the_integrated_profile","Skewness_of_the_integrated_profile",
                   "Mean_of_the_DM_SNR_curve","Standard_deviation_of_the_DM_SNR_curve",
                   "Excess_kurtosis_of_the_DM_SNR_curve","Skewness_of_the_DM_SNR_curve","target_class" )
0-2) Random Forest를 위해 target_class 변수를 factor로 바꿔주자
data$target_class = as.factor(data$target_class)1) Train-Test Split
set.seed(0226)
star_split <- rsample::initial_split(data, prop = 0.5, strata = target_class)

train <- training(star_split)
test <- testing(star_split)

print(nrow(train))
## [1] 8949print(nrow(test))## [1] 89492) Random Forest Modeling
p = ncol(train) - 1 # class 뺀 X변수들의 숫자
n = nrow(train)

mtry = floor(seq(0.1, 1, by = 0.1) * p)
nsize = round(c(1, n * seq(0.01, 0.1, by = 0.01)))

pna = matrix(NA, nrow = length(mtry), ncol = length(nsize))
pnadf = data.frame()

for( i in 1:length(mtry)){
  for( j in 1:length(nsize)){
    m = mtry[i]
    n = nsize[j]
    rf = randomForest(target_class~.,
                      data = train, ntree = 100, mtry = m,
                      nodesize = n, set.seed(0226))
    pred = predict(rf, newdata = test, type = 'prob')

    roccurve0 = roc(test$target_class ~ pred[,2])

    auc = roccurve0$auc %>% as.numeric()

    pna[i,j] = auc
    pnadf = rbind(pnadf, c(m,n,auc))
  }
}

rownames(pna) = mtry
colnames(pna) = nsize

pna
## 1 89 179 268 358 447 537
## 0 0.9655894 0.9478434 0.9514007 0.9489635 0.9482192 0.9526655 0.9480747
## 1 0.9655894 0.9478434 0.9514007 0.9489635 0.9482192 0.9526655 0.9480747
## 2 0.9658301 0.9545747 0.9501529 0.9506757 0.9499466 0.9527863 0.9425445
## 3 0.9672799 0.9502650 0.9495637 0.9495012 0.9497061 0.9484140 0.9440998
## 4 0.9648768 0.9487849 0.9530485 0.9451542 0.9483413 0.9450359 0.9446473
## 4 0.9648768 0.9487849 0.9530485 0.9451542 0.9483413 0.9450359 0.9446473
## 5 0.9678321 0.9556995 0.9489808 0.9474433 0.9456023 0.9461395 0.9421235
## 6 0.9678004 0.9523885 0.9511687 0.9407779 0.9421318 0.9456583 0.9436566
## 7 0.9651534 0.9533287 0.9447496 0.9446937 0.9436194 0.9438521 0.9458295
## 8 0.9669586 0.9510696 0.9443655 0.9332648 0.9322425 0.9249996 0.9302646
## 626 716 805 895
## 0 0.9497824 0.9510453 0.9502049 0.9364539
## 1 0.9497824 0.9510453 0.9502049 0.9364539
## 2 0.9383514 0.9507290 0.9505942 0.9487513
## 3 0.9393807 0.9404574 0.9345050 0.9449459
## 4 0.9392114 0.9394300 0.9411547 0.9422191
## 4 0.9392114 0.9394300 0.9411547 0.9422191
## 5 0.9393145 0.9383569 0.9352619 0.9372310
## 6 0.9368283 0.9326136 0.9399175 0.9374897
## 7 0.9453812 0.9360155 0.9294285 0.9285424
## 8 0.9213968 0.9208511 0.9205902 0.9200889randomForest 과정중에 반복되는 메세지와 경고가 출력되어 rmarkdown에 message=FALSE, warning=FALSE를 주어 생략하였다.
위와 같은 mtrym nodesize auc 조합이 만들어졌다.
3) 3D Surface Graph
persp3D(mtry, nsize, pna, theta=110, phi=30, axes=TRUE,scale= 0.75, box=TRUE, nticks=5,

        ticktype="detailed", xlab = "mtry", ylab= "nodesize", zlab = "AUROC")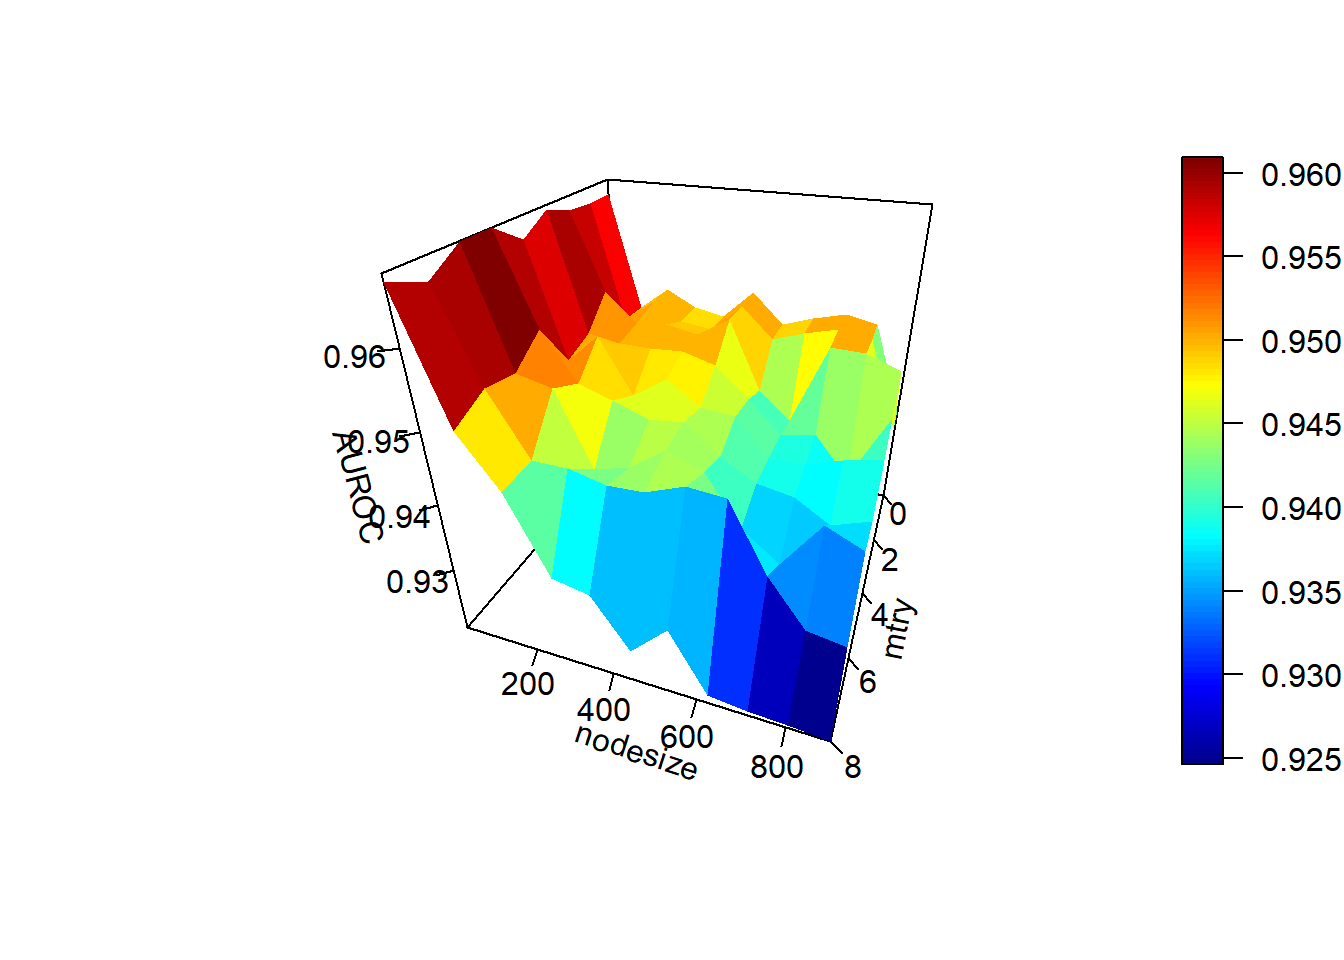
colnames(pnadf) = c("mtry", "nodesize", "AUC")그래프를 봤을 때, nodesize가 200 이하이고, mtry 가 5인 지점에서 가장 짙은 적색이 보이며 AUC 약 0.97로 가장 높아보인다.
4) AUC를 max로 하는 mtry과 nodesize 찾기
df = pnadf %>%
  filter(AUC == max(AUC))

print(df)
## mtry nodesize AUC
## 1 5 1 0.9678321